A stage report connects the chemical-rate history with the job record. Reading it well means separating measured rates, calculated totals, sampled information and operating context.
Begin with the stage and the record.
Before interpreting a line on a chart, identify the stage, start and end times, chemical channels and units. Confirm that the record corresponds to the treatment being reviewed. A rate trace without its job context can show a change clearly while leaving the cause of that change unknown.
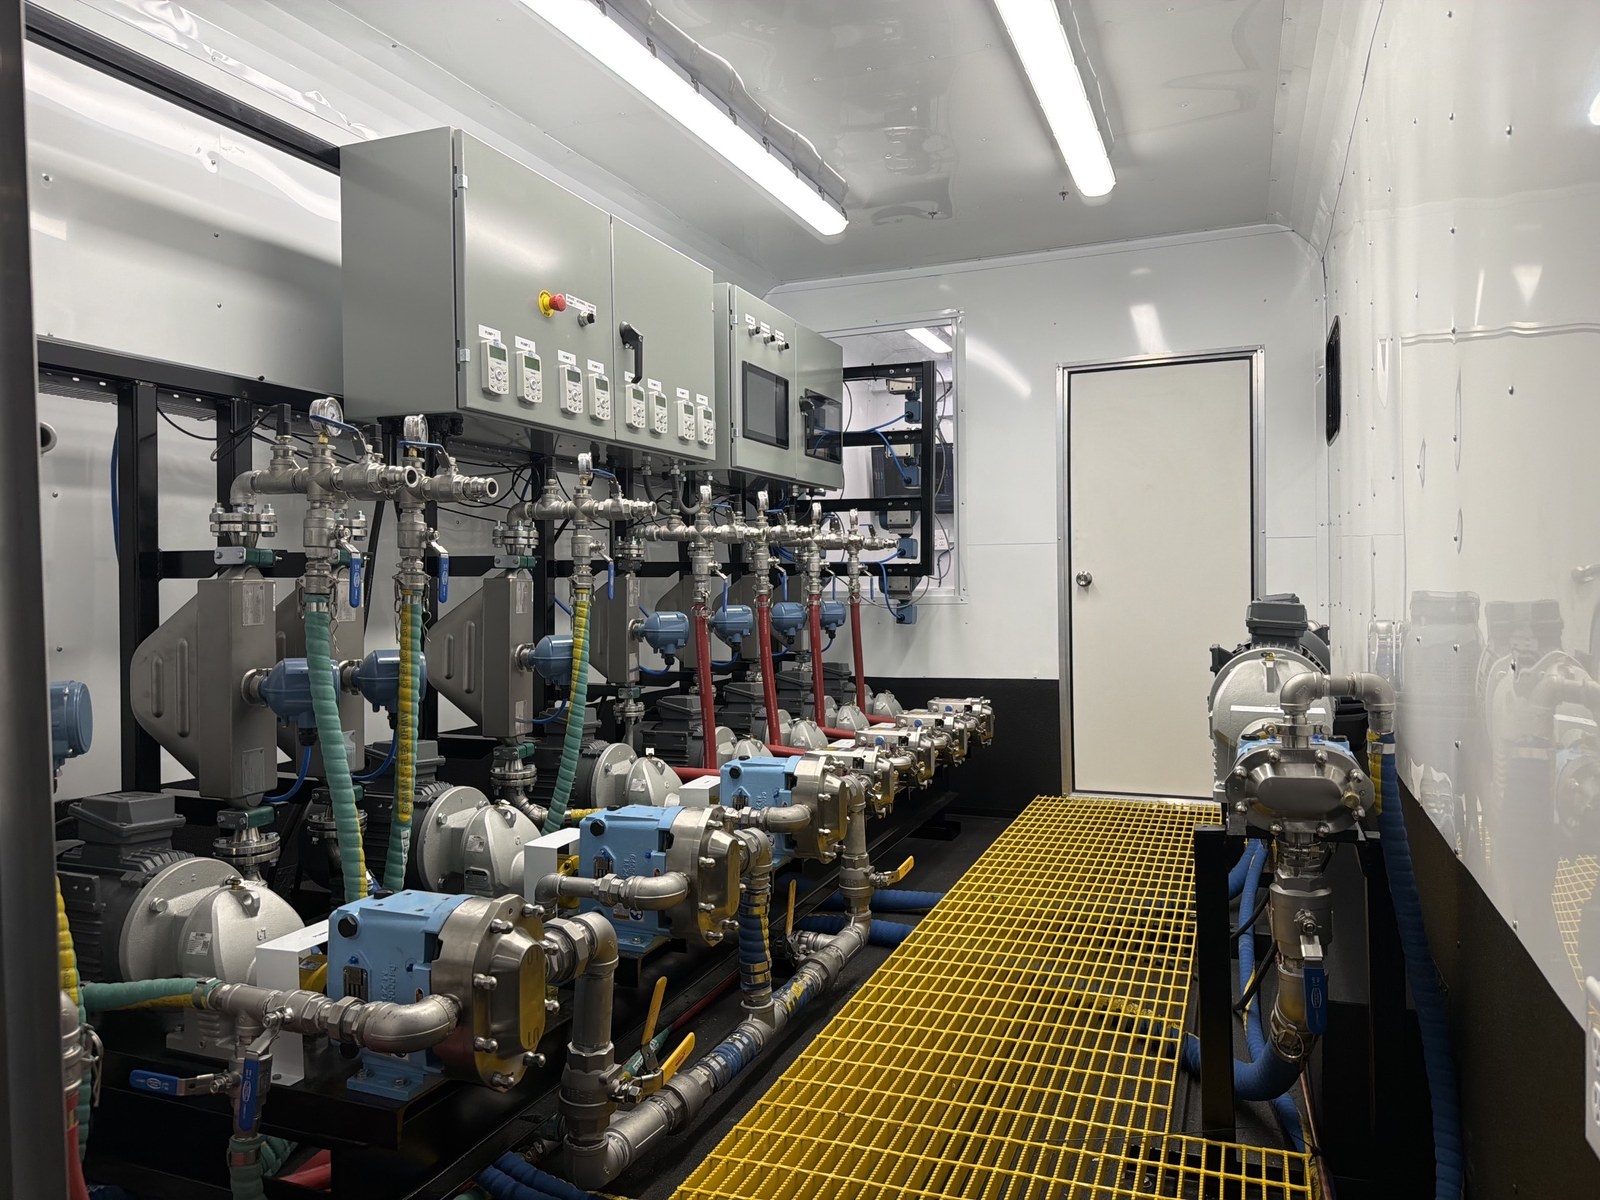
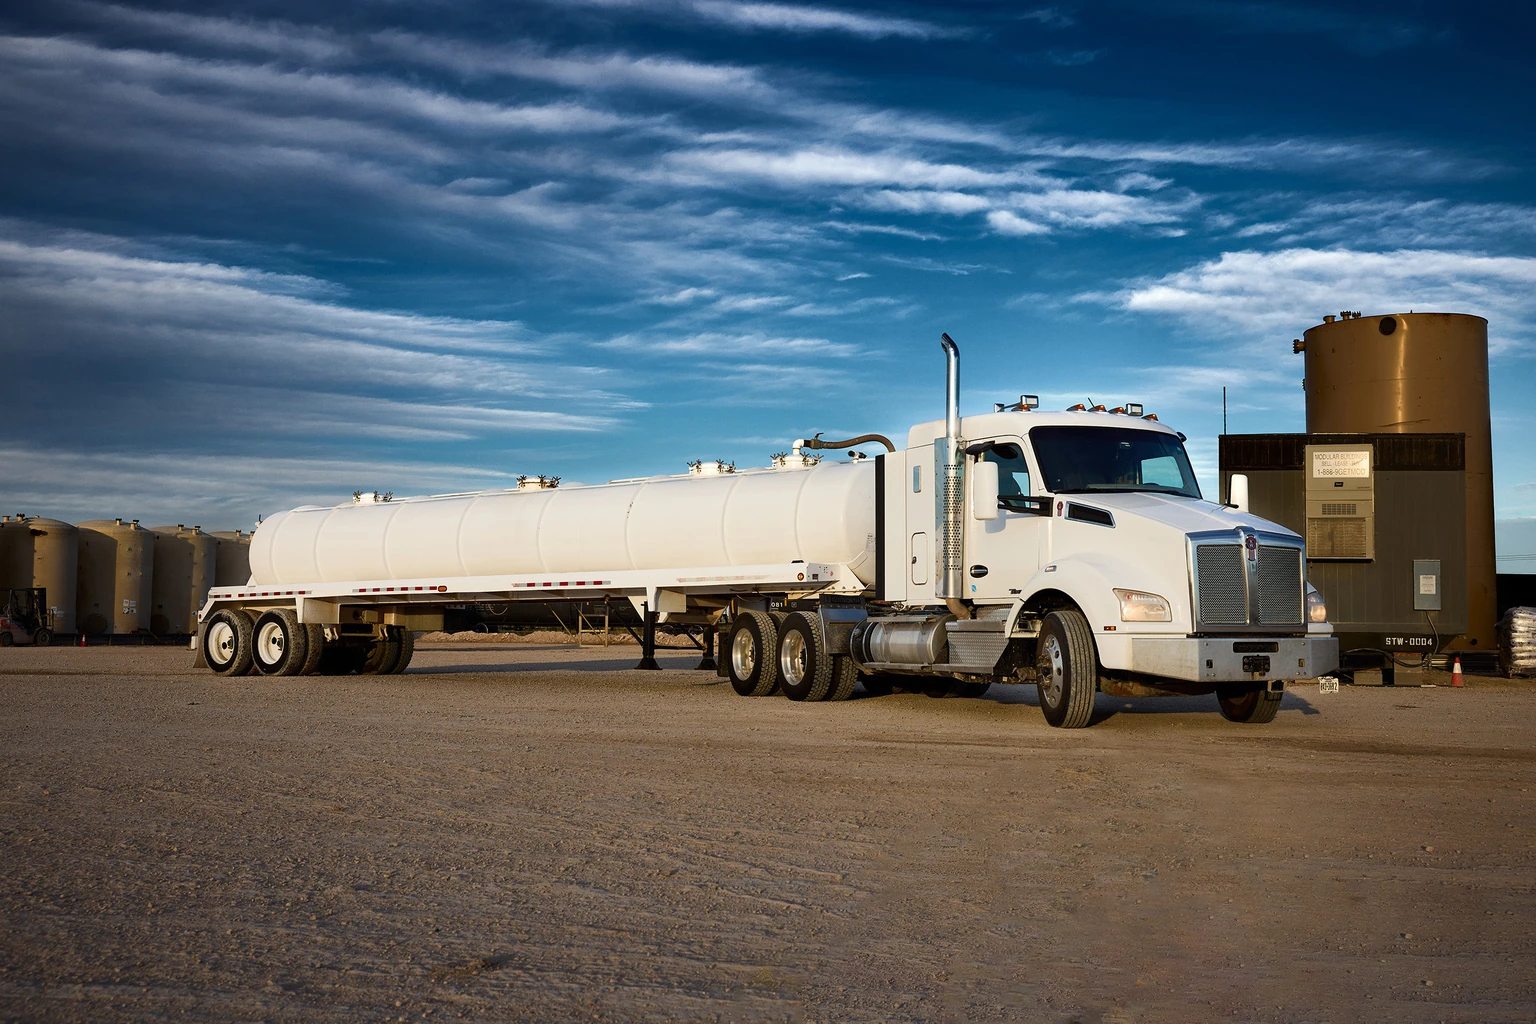
The Matrix Chem Add Trailer uses Coriolis-metered chemical channels and records at two-second intervals. Define the reporting scope before the job: which channels are included, how the timestamps align and which other operating records are needed for interpretation.
Read the chemical-rate traces.
The representative stage chart shows friction reducer, biocide and scale inhibitor in gallons per thousand gallons, or GPT. Each series contains 84 plotted readings, arranged in reading sequence.
The chart shows how chemical concentrations change through the stage. Elapsed time, chemical volume and total usage require the time-stamped stage export and the relevant water-rate record. Use the chart to locate changes, then use the job record to investigate them.
Chemical rate through a stage
Friction reducer, biocide and scale inhibitor shown on the same concentration basis.
GPT / gallons per 1,000 gallons
- Friction reducer
- Biocide
- Scale inhibitor
Representative stage · 84 plotted readings per chemical · Reading sequence on x-axis
A concentration trace is not a total-volume trace.
GPT expresses a chemical volume relative to a water volume. It is a concentration basis, not the total amount of chemical used during a stage. To relate a GPT target to chemical flow, the water rate and the unit conversions also have to be known.
For example, if water flow is already expressed in gallons per minute, multiplying that rate by the GPT value and dividing by 1,000 gives a corresponding chemical-volume rate in gallons per minute. This is a unit relationship, not a dosage recommendation. Integrating a rate over the actual time record is a separate step, and requires the correct timestamps and treatment of gaps.
Look at transitions before judging stability.
The representative stage includes startup, a sustained FR level, a later FR-rate change and a shutdown. The biocide and scale-inhibitor traces provide additional context. A change in one line does not establish whether the event was a planned setpoint change, an operator action, a water-rate change or an equipment issue.
Compare the trace with the stage schedule, operator notes and the relevant water or treatment record. Ask whether the timestamps align and whether a pause or change was expected. The chart helps locate the event to investigate; it does not supply every explanation by itself.
Know how each report value is produced.
The trailer reporting package includes six outputs: a field ticket, stage report, water analysis, tank-strapping record, chemical-rate graph and CSV export. They serve different purposes. The rate graph and export concern the recorded chemical history. Water analysis concerns sampled fluid. A tank record concerns inventory measurement or reconciliation.
Agree how each item is generated and reviewed for the job. A report can combine instrumented data with sampled, entered or calculated information. The presence of a value in a report does not mean that the trailer measured it automatically. Clear labels make the record more useful to both the operating team and the customer reviewing it later.
Reconcile usage with the supply record.
Chemical totals become more useful when connected to what was delivered, what remained in storage and what was assigned to the stage or treatment. The reporting scope should identify the basis of each quantity and the times at which stock observations were made.
Differences between a tank observation and an instrumented total should prompt a review of timing, measurement basis and the relevant movements. Do not assume that two quantities describe the same interval or boundary simply because both appear in gallons. The goal is a traceable handoff between field usage and the next inventory decision.
Remote access supports the review.
The Matrix Chem Add Trailer supports local operation with remote visibility and control available through the agreed configuration. Access depends on the agreed configuration, connectivity and customer permissions. A remotely visible trend can support a conversation with the field team, but the responsibilities for operating decisions still need to be defined.
Reporting and automatic control serve different functions. The current trailer uses operator-set rate control with manual backup. Agree how setpoint changes, operator actions and remote access will be recorded for the job.
Keep the stage record traceable.
Keep the stage identifier, chemical-channel names, units and timestamps with the exported data. Retain operator notes and any corrections alongside the original record so the operating team can trace a charted event back to the job.
Ask for a report that answers the job question.
Before the program begins, agree the identifiers, chemical names, units, time basis, report recipients and export requirements. Identify the water or treatment data needed to interpret the chemical record. Ask how samples, operator observations and corrections will be attached to the report.
A useful stage report is more than a chart with smooth lines. It makes the treatment history understandable, supports a review of specific events and connects chemical use with the next operational or supply decision. Matrix can scope those reporting needs alongside the trailer and field-service requirements.